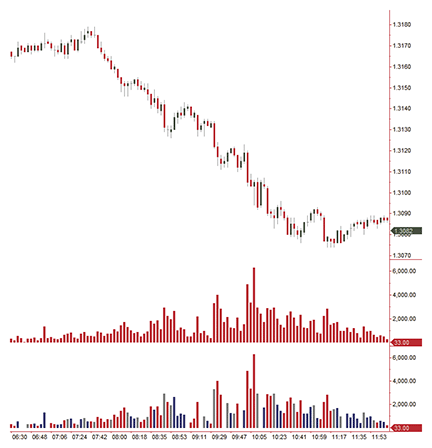
Original article - 1st step
As represented here: http://www.traders.com/index.php/sac-magazine/current-contents/feature-articles/73-trading-forex/1722-volume-and-divergence- Details
- Parent Category: Featured Articles
- Category: Trading Forex
- Written by Gail Mercer
The Trader’s Bread And Butter
Here’s how you can use a divergence between price and volume for trading forex futures or exchange traded funds.
The first time I looked at volume on my charts, I thought there had to be something significant in those bars, but I just could not put my finger on what it was. So to find out, I read books, went to seminars, attended online webinars, and studied all the cutting-edge techniques: the low-volume bars, the high-volume bars, the ultra high-volume bars, the signs of weakness, and the signs of strength. Yet on the live edge of the market, the concepts eluded me.Instead of trading, I found myself frozen with fear of pulling the trigger because I did not know if there were hidden buyers or sellers behind the bar.
Know your buyers and sellers
After years of frustration I simply took volume off my charts altogether, realizing I might not ever be able to read those little sticks as others could. In lieu of volume, I opted to simply focus on price with my analysis premise defined around price making higher highs and lows, or lower lows and highs, or in congestion (erratic highs and lows).
As I continued to analyze the markets that way, I revamped my understanding of volume to price with a simplified approach. This new method took my volume analysis to the following two questions: was the close greater than the open (buyers), or was it less than the open (sellers)? That was all I needed to know regarding volume.
2. Prorealtime formula
// According to the articles "Volume and Divergence" by Gail Mercer, September 2012, Stocks & Commodities,// this indicator is an adaptation of the original article, since different colors of a volume histogram
// are not possible in Pro Real Time
// this a binary indicator
// variable = n (number of days)
if high >= highest[n](customclose) and volume >= highest[n](volume) then
vd = 1
elsif low >= lowest[n](customclose) and volume >= highest[n](volume) then
vd = - 1
else
vd = 0
endif
vdd = vd * volume
// draw vdd as histogram, multplie by volume for a major "visual effect"
return vdd as "Volume divergence"
3. Results
As you can see in the image below, the indicator is rejected since it gives too many false signals.More than indicating a trend, this indicator confirms a trend (already started after a while) or gives the announce of an end ("final selling" or "final buying"), but you cannot distinguish clearly the situation!!
==> rejected
Questo e-mail le é stato inviato da Marcello Succi via ProRealTime.
ProRealTime.com: Software di borsa on-line per l'analisi grafica e il trading.
Dati in tempo reale affidabili tick per tick e storici intraday per azioni, futures, indici, valute/forex...
Crei un conto GRATUITAMENTE e inizi ad utilizzare il nostro software di borsa on-line da adesso e senza bisogno d'installazione!Any source


No comments:
Post a Comment